What is Graphy?
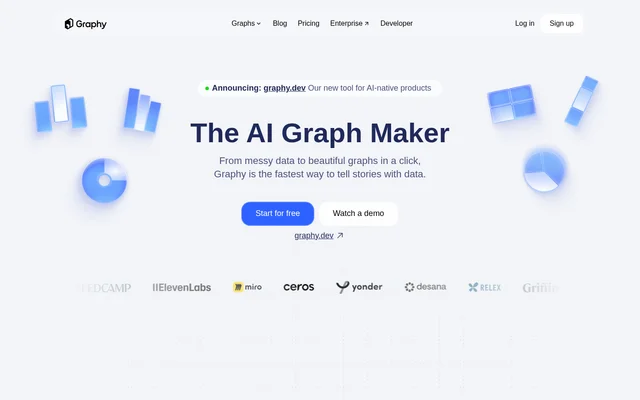
Graphy is a web-based AI graph maker and data visualization tool for turning datasets into charts and stories. Graphy combines automated analysis, conversational data exploration, and visual customization for people who need to explain numbers to colleagues, investors, customers, or public audiences.
Graphy emphasizes communication alongside analysis. The website describes charts with headline takeaways, annotations, and branding rather than presenting numbers without context. Customer examples cover marketing reporting, finance communications, consulting content, and board memos, illustrating how Graphy supports both internal reporting and externally shared visualizations.
What Graphy can do
Graphy brings data input, chart generation, interpretation, and presentation into a shared workflow. Graphy can inspect dataset rows, suggest charts, and highlight insights, while chat lets users request a different chart or ask for an answer about their data. Branding and annotation features support the final communication step.
- Graphy connects to live Google Sheets.
- Graphy imports CSV and Excel files and accepts pasted or typed values.
- Graphy accepts data through an API and supports AI-assisted data search.
- Graphy generates charts with headline takeaways.
- Graphy answers questions through data chat.
- Graphy applies brand colors, fonts, and style to charts.
- Graphy adds annotations to highlight findings.
- Graphy exports charts and supports interactive, embeddable visualizations.
How Graphy works
Graphy starts with a connected spreadsheet, uploaded file, manually entered values, an API call, or an AI data search. The website states that data does not need preparation or formatting before ingestion. Graphy then analyzes the dataset and presents chart suggestions and insights, with visibility into how the analysis was reached.
Graphy supports follow-up requests through chat when users want another chart, insight, or answer. After analysis, users can apply their visual identity and add annotations. Graphy then provides export or embedding options for placing the resulting charts in slides, documents, social posts, and team updates.
Who Graphy is for
Graphy serves people who need to communicate findings from data, including marketing teams, finance professionals, analysts, founders, and consultants. The customer examples describe both internal and external communication, from reporting and board materials to newsletters and social feeds. Graphy also supports explanations of numbers for investors and team members.
- Graphy supports internal reporting and board memos.
- Graphy helps marketers present reporting insights.
- Graphy creates charts for newsletters and social feeds.
- Graphy supports investor and team communications.
- Graphy provides visualizations for consulting content.
Graphy pricing and plans
Graphy uses a freemium model, according to the page's structured product information, and the website offers a free starting option. Graphy provides sign-up and login links, along with links labeled Pricing and Enterprise. The supplied text does not describe paid plan amounts, free-tier allowances, or feature differences between plans.
Graphy strengths and documented scope
Graphy combines several concrete capabilities: multiple data-input methods, AI chart suggestions, conversational analysis, brand customization, and sharing through export or embedding. Graphy therefore covers the path from importing data to presenting findings. The supplied page does not specify usage limits, supported export file types, or which features belong to particular pricing tiers.
Graphy FAQ
What is Graphy?
Graphy is a web-based AI graph maker that turns datasets into charts and data stories. Graphy combines AI-generated insights, conversational data questions, chart branding, annotations, and export or embedding options for communicating findings.
Is Graphy free?
Graphy offers a free starting option and is identified as freemium in the page's structured product information. Graphy does not list paid plan prices, free-tier allowances, or feature restrictions in the supplied page text.
What data sources does Graphy support?
Graphy supports live Google Sheets connections, CSV and Excel uploads, pasted or typed values, API calls, and AI-assisted data search. Graphy states that users do not need to prepare or format their data before ingestion.
Can Graphy answer questions about data?
Graphy supports chatting with datasets to request charts, insights, or answers. Graphy analyzes data, highlights findings, and lets users ask for a different chart, while the website states that users can see how the analysis was reached.
Can Graphy create branded charts for sharing?
Graphy can apply brand colors, fonts, and style to charts and add annotations to highlight findings. Graphy supports exporting or embedding visualizations for use in slides, documents, social posts, and team updates.
Who is Graphy for?
Graphy serves data storytellers, including marketers, finance teams, analysts, founders, and consultants. Graphy customer examples describe internal reporting, board memos, investor communications, newsletters, social feeds, and consulting content as uses for charts and visualizations.
From the community
No reviews yet
Be the first to review this tool. What you write helps the next person choose.